What’s Inside
Axionis Decision Intelligence System
Not a template. A system.
Ecommerce Growth Intelligence System
Stop Bleeding Margin: The Complete Profit Operating System for Shopify Stores
You’re generating revenue but your margin keeps shrinking — and you can’t pinpoint why because your data lives in five different reports that never talk to each other. Spreadsheet exports, ad dashboards, and inventory guesses don’t add up to a decision — they add up to noise. The Ecommerce Growth Intelligence System connects six pre-built tools into one weekly operating rhythm: a Product Profitability Scoring Matrix that ranks every SKU by real contribution margin, an Ad-to-Margin Alignment Engine that calculates the exact ROAS floor below which you’re losing money, and a 90-Day Sprint Planner that removes all decision paralysis by telling you exactly what to do each week. Store owners using this system identify their top three margin traps in the first 60 minutes and reclaim 10–20% of profit currently lost to poor product mix and unfocused ad spend.
Who This Is For
- Shopify store owners doing $5K–$30K/month who are profitable on paper but can’t explain why their margin keeps dropping
- WooCommerce founders running 20–60 SKUs who are scaling ad spend without knowing which products actually make money after returns and COGS
- E-commerce operators who’ve outgrown gut-feel decisions but can’t afford a fractional CFO or analyst at $200+/hour
- Side-income store builders turning a profitable hobby into a real business who need a system — not more dashboards — to make weekly decisions with confidence

What’s Included
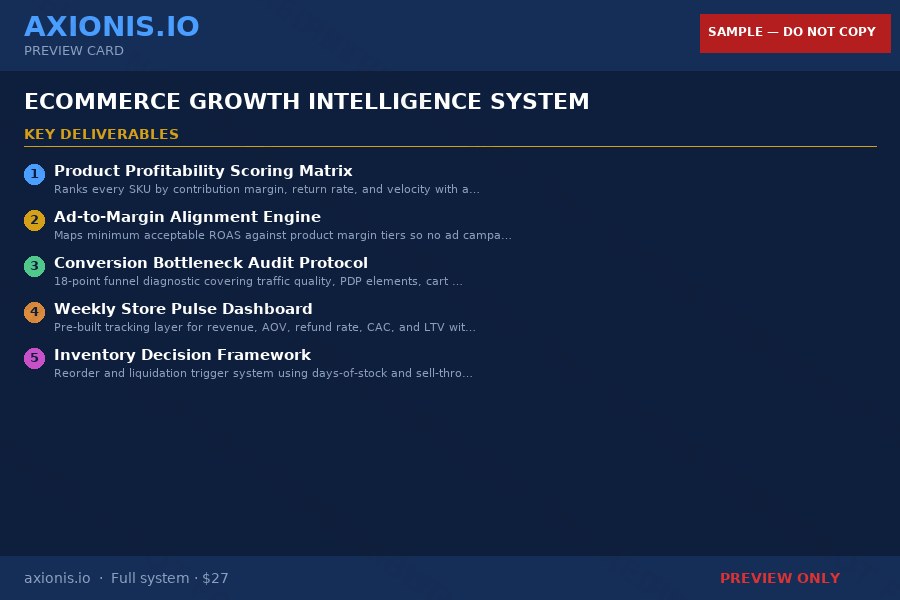
- Product Profitability Scoring Matrix (Google Sheets) — ranks every SKU by margin, velocity, and return rate with auto-tags: SCALE, KEEP, MONITOR, or CUT
- Ad-to-Margin Alignment Engine (Excel) — calculates the exact minimum ROAS for each product’s margin tier so you never scale a campaign that loses money
- Conversion Bottleneck Audit Protocol (PDF + Notion template) — 18-point scored diagnostic across Traffic, Product Page, Cart, and Checkout with a prioritized fix sequence
- Weekly Store Pulse Dashboard (Google Sheets) — tracks 8 core metrics against a rolling 4-week baseline with variance alerts that flag problems before they compound
- Inventory Decision Framework (PDF flowchart + Google Sheets calculator) — tells you exactly when to reorder, discount, or discontinue each SKU using sell-through rate and margin data
- 90-Day Growth Sprint Planner (Google Sheets + PDF) — week-by-week roadmap with specific tasks, time estimates, and which tool to use each week so you always know what to do next
How You’ll Use This
Shopify Store Owner (Solo Operator)
She’s running $22K/month in revenue but her net margin dropped from 28% to 19% over six months and she doesn’t know which products, ads, or returns are responsible
→ She inputs her top 15 SKUs into the Product Profitability Scoring Matrix, identifies two high-revenue products with sub-15% margin she’s been actively advertising, and kills $800/month in unprofitable ad spend within the first week
E-commerce Brand Manager (Small Team)
He manages a WooCommerce store with 45 SKUs and needs a weekly reporting process his team can run consistently without him pulling data from three platforms every Monday morning
→ He sets up the Weekly Store Pulse Dashboard once, delegates the 30-minute weekly input to a VA, and gets a color-coded variance report every Monday that flags any metric more than 15% off baseline — without touching a spreadsheet himself
Side-Income Store Builder
She launched a Shopify store eight months ago, hit $6K/month, and is ready to invest in ads — but doesn’t know which products to promote or what ROAS she needs to actually make money
→ She uses the Ad-to-Margin Alignment Engine to calculate her minimum ROAS for each product tier before spending a dollar on ads, then follows the 90-Day Sprint Planner to launch her first campaigns only on SCALE-tagged SKUs
Why It Matters
Ad costs on Meta and Google have risen 20–30% over the past two years while average e-commerce conversion rates have held flat — meaning the stores that survive the next 18 months are the ones making margin-first decisions, not revenue-first ones. At the same time, Shopify’s native analytics and most third-party tools surface revenue and ROAS without connecting those numbers to actual contribution margin per SKU — leaving store owners optimizing for the wrong metric entirely.
Store owners without a margin-aware operating system keep scaling their best-selling products, not their most profitable ones — a distinction that quietly destroys cash flow at $15K/month and becomes a crisis at $40K/month. Store owners who run a weekly margin review, align ad spend to ROAS floors, and make inventory decisions from sell-through data instead of instinct consistently recover 10–20% of margin that was already being generated — they just weren’t capturing it. At $47, this system costs less than 15 minutes of a consultant’s time and delivers the same decision framework.
What You Get
- ✅ Identify your top 3 margin-draining SKUs in your first 60 minutes using the pre-filled Product Profitability Scoring Matrix
- ✅ Calculate the exact minimum ROAS for every product so you never fund a campaign that looks profitable but isn’t
- ✅ Complete a full store performance review in 30 minutes per week instead of manually pulling and comparing five separate reports
- ✅ Know exactly when to reorder, discount, or discontinue each SKU using sell-through rate and margin data — not inventory gut feel
- ✅ Follow a week-by-week 90-day action plan that tells you exactly which tool to use, what to do, and how long it takes — no decision paralysis
📊 System Preview
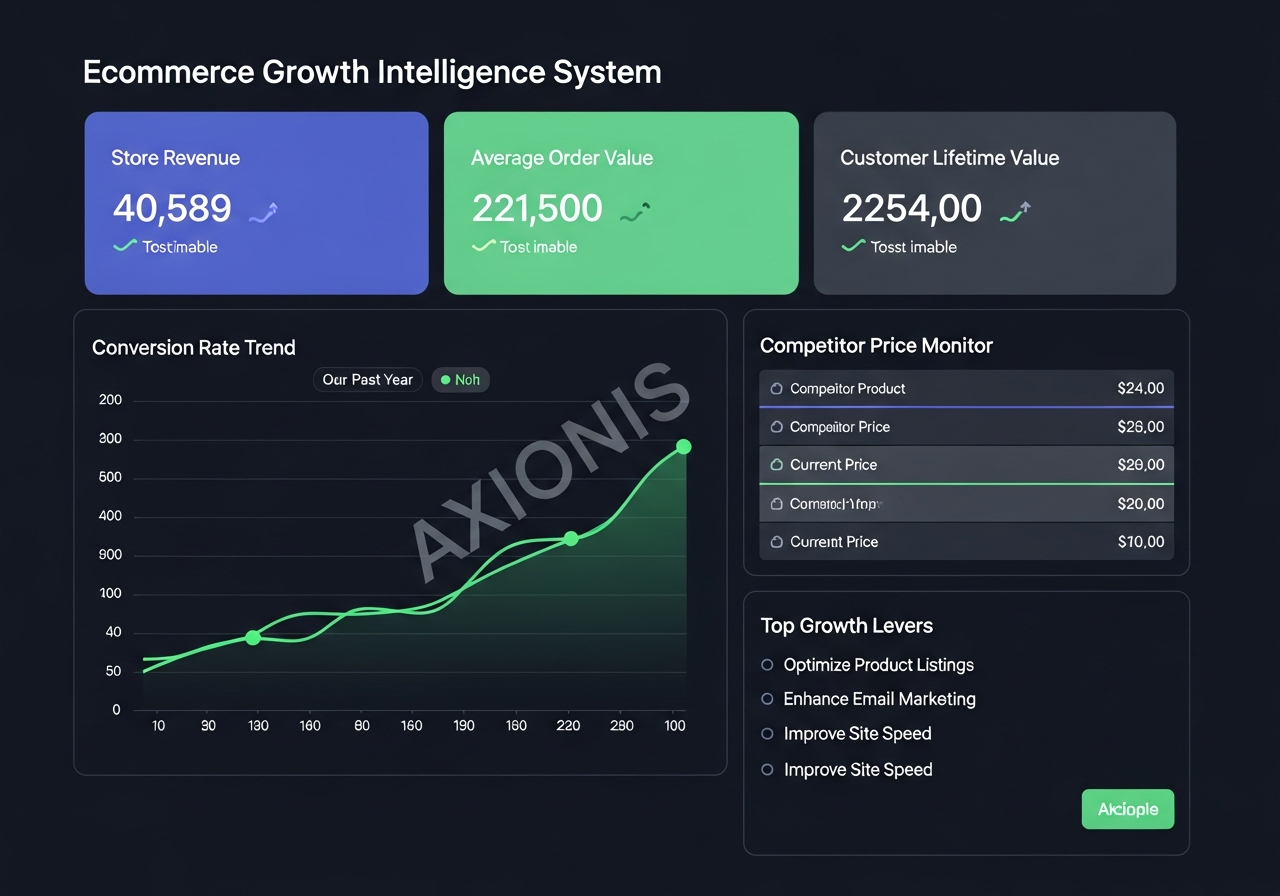
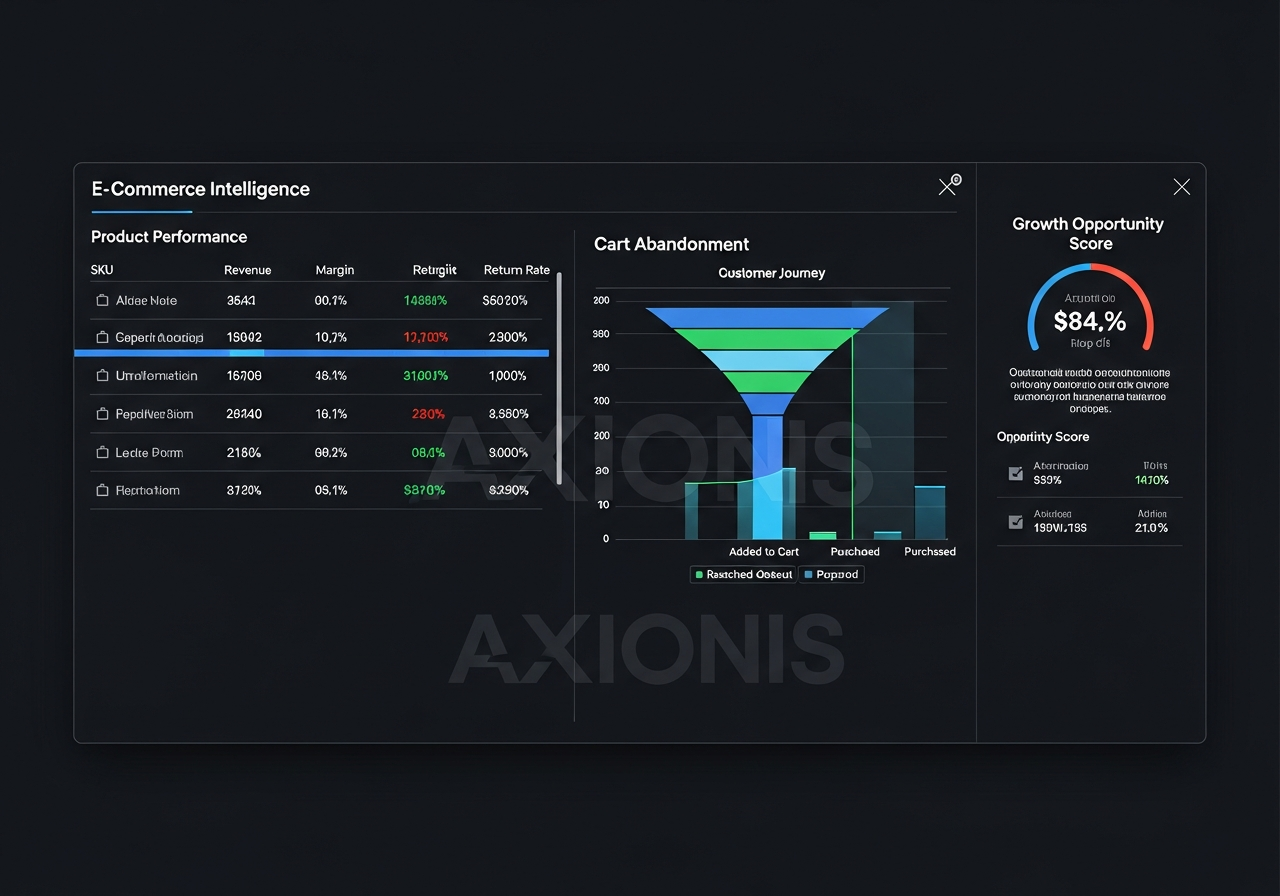
The Weekly Store Pulse Dashboard opens to a color-coded scorecard showing eight metrics side-by-side — Revenue, AOV, CAC, ROAS, Refund Rate, Conversion Rate, and LTV:CAC — each with a green, yellow, or red variance indicator comparing the current week to a rolling four-week baseline. Below the scorecard, the Danger Sign Decoder panel explains what each red flag means in plain language, and the Axionis Diagnostic Tree guides you to the root cause when multiple metrics flag simultaneously. The Product Profitability Scoring Matrix sits alongside it as a ranked SKU table with color-banded margin tiers and bold action tags in the final column.
🎁 Free Resource
The Ecommerce Margin Trap Checklist: 7 Signs Your Store Is Profitable on Paper but Bleeding Cash
A one-page diagnostic for Shopify and WooCommerce owners that identifies the seven most common margin traps — from high-revenue low-margin SKUs to ROAS figures that look good but lose money — with a quick self-score to prioritize which problem to fix first
Download the Free Checklist →
Every week you run ads without a margin-safe ROAS floor, you’re paying to sell products that lose money.
👉 Download the Ecommerce Growth Intelligence System
One-time purchase · Instant download · No subscription
⚡ Complete the System
Pair this system with a Customer Lifetime Value and retention analysis toolkit to see which of your margin-positive customers are worth acquiring at higher CAC — because fixing your product mix is only half the equation if your repeat purchase rate is leaving revenue on the table.
📖 Related Intelligence Guides
Filed under: Business Tools
⚡ Axionis
Decision Intelligence System
Support: support@axionis.io
Digital download · Instant access · One-time purchase

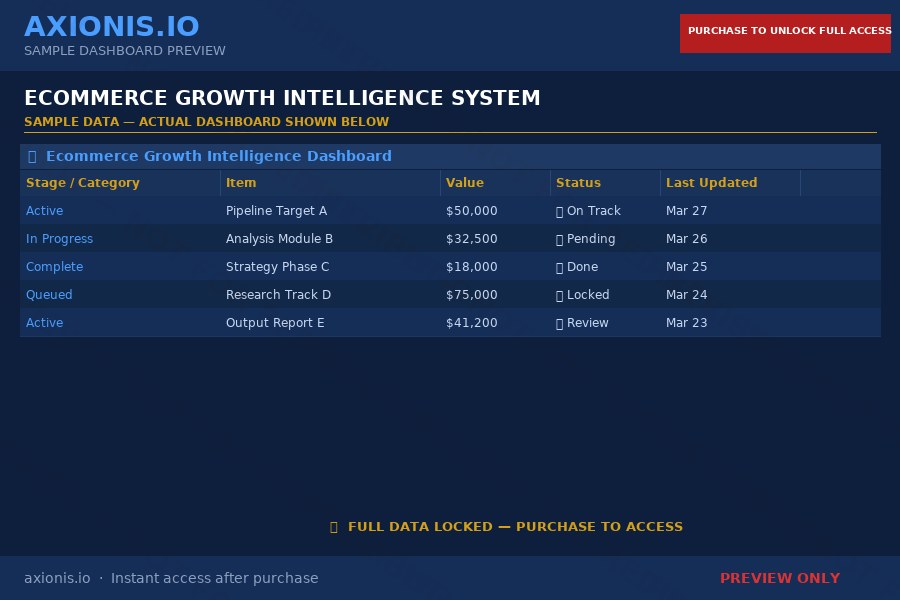
These are watermarked preview samples. Full, clean versions are delivered instantly after purchase.


These are watermarked preview samples. Full, clean versions delivered instantly after purchase.